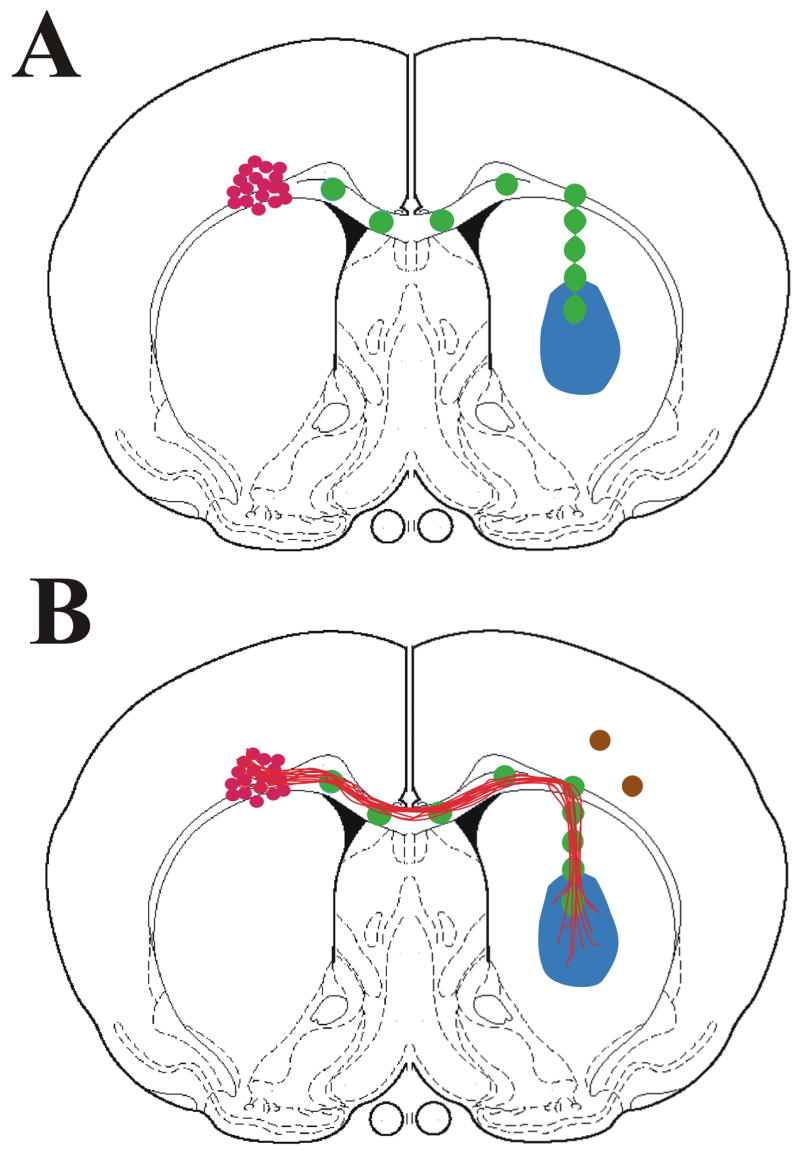
Figure 3.

Schematic diagram of coronal cross sections of the rat brain. (A) Adenovirus encoding a target neurotrophic source is injected into the striatum (blue). A pathway of nine smaller injections (green) of a second adenovirus is created from the striatum to the corpus callosum that follows the corpus callosum to the opposite hemisphere. DRG neurons (red) are transplanted above the corpus callosum in the hemisphere contralateral to the target two days post-injection. (B) If the pathway supports growth, axons (red) should grow along the corpus callosum into the contralateral hemisphere and turn toward the target neurotrophic source. To increase the number of axons turning semaphoring (brown circles) are placed at the distal end of the pathway, just after the turning point.
