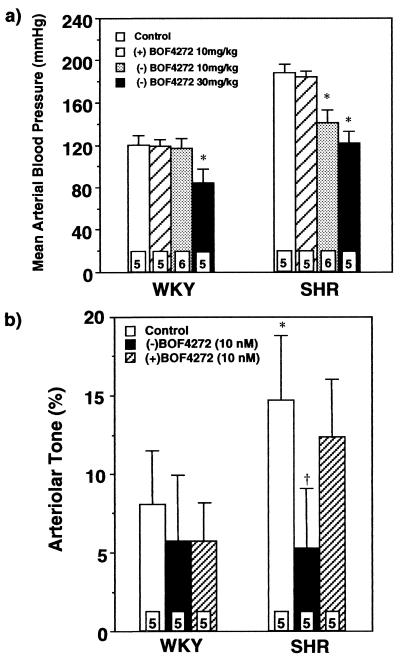
Figure 2.
(a) The mean arterial blood pressure before and after the administration of (−)BOF4272 or (+)BOF4272 to WKY rats or to SHR. ∗, P < 0.05 as compared with that of the control in each animal. (b) Arteriolar tone before and after the administration of (−)BOF4272 or (+)BOF4272 to WKY rats and SHR. ∗, P < 0.05 as compared with that of control WKY rats; †, P < 0.05 as compared with that of control SHR. The number at the bottom of each column indicates the number of animals.

