Figure 3.
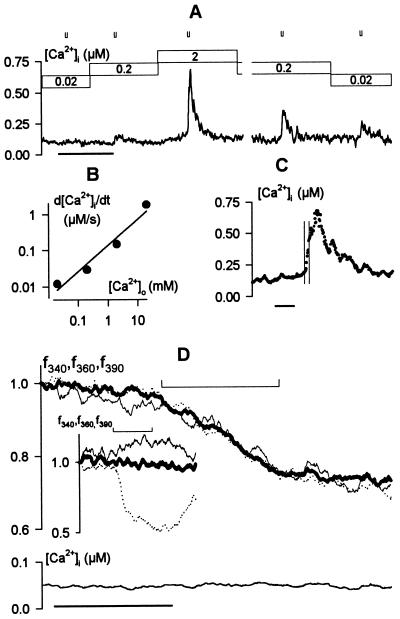
Increases in [Ca2+]i are dependent on the extracellular Ca2+ concentration and triggered by Ca2+ influx. Data from one Vicia guard cell in 5 mM K+-Mes, pH 6.1, and KCl (= 10 mM K+), with 0.02–20 mM CaCl2 (A–C) and from a second cell with 2 mM MnCl2 instead of CaCl2 (D). (A) [Ca2+]i record during exposures to 0.02, 0.2, and 2 mM CaCl2 (bars above). The cell was clamped to −50 mV throughout with 4-s steps to −200 mV at times indicated (⊔). Time scale, 2 min. (B) Mean rate of rise in [Ca2+]i (d[Ca2+]i/dt) during voltage steps plotted as a function of extracellular Ca2+ concentration shows roughly a 10-fold increase with each decade change in [Ca2+]o. (C) [Ca2+]i rise evoked on stepping to −200 mV continues to increase after returning to −50 mV. Data from the A in 2 mM [Ca2+]o replotted on an expanded time scale. Period of clamp step to −200 mV indicated by vertical hairlines. Time scale, 10 s. (D) Fura2 fluorescence (Upper) recorded on excitation with 340 nm (f340, fine line), 360 nm (f360, heavy line), and 390 nm (f390, dotted line) light, and the corresponding [Ca2+]i signal (Lower). Time scale, 20 s. Note the approximate 20% quench of fluorescence excited at all three wavelengths during the 20-s step to −200 mV (⊔, Upper) and the absence of any change in [Ca2+]i. (Inset) Fura2 fluorescence excited at 340, 360, and 390 nm during the first 20-s voltage step (⊔) in Fig. 1B for comparison.

