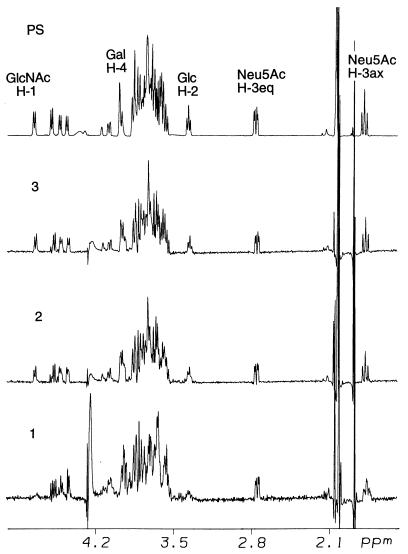
Figure 4.
1H NMR spectra of type III GBS polysaccharide (spectrum PS) and the oligosaccharides of fractions 3, 2, and 1 from Fig. 3 (spectra 3–1). The repeating unit contains five residues, as shown by four anomeric signals between 4.4 and 4.8 ppm, and a pair of sialic acid H-3 signals. Spectra 3 and 2 are nearly identical to spectrum PS, indicating that they have the same basic structure as the polymer. In spectra 3–1, the galactose H-4 resonances were shifted to the right and the intensity of Glc H-2 resonances decreased progressively, and the GlcNAc H-1 signal disappeared in spectrum 1; these differences suggest that galactose, Glc, and GlcNAc were affected by ozonolysis.

