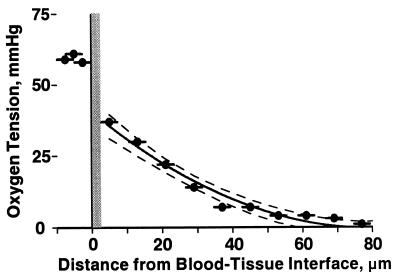
Figure 3.
Example of pO2 profile found in the rat mesentery. Closely sampled pO2 measurements allow for a detailed view of tissue pO2 profile. Solid line is the curve fitting of the pO2 profile within the tissue, dotted lines are the 95% confidence intervals of the data. Intravascular pO2 averaged 59.3 ± 1.5 mmHg (horizontal bar), shown left of the blood tissue-interface. The wall was taken to be 2.5 μm thick, and each data point represents the pO2 within the sampling window whose width is represented by the horizontal bars.

