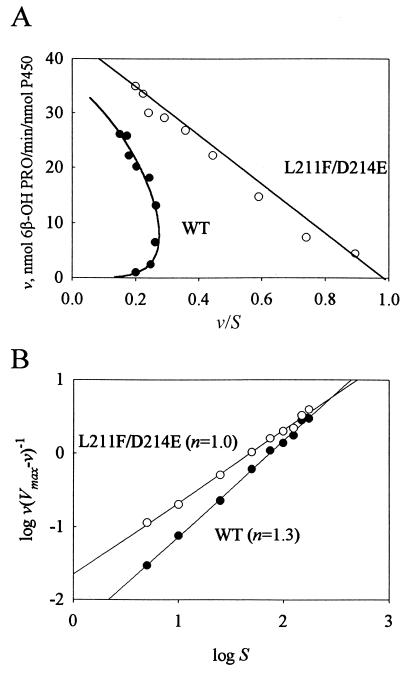
Figure 2.
Kinetic analysis of progesterone hydroxylation by P450 3A4 (•) and L211F/D214E (○). Assays were performed as described by using nine different substrate concentrations ranging from 5 to 175 μM. (A) Eadie–Hofstee analysis of progesterone hydroxylase assays. Wild-type data points were fit to a plot of the Hill equation. Linear regression was used to fit the L211F/D214E data. (B) Linear regression of the plots of log[v/(Vmax − v)] vs. log S.

