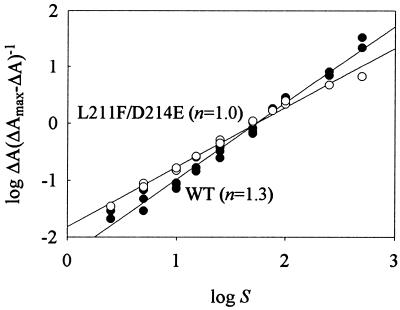
Figure 3.
Analysis of testosterone binding by spectral titration. P450 (0.5 μM) 3A4 wild-type (•) or L211F/D214E (○) was titrated with concentrations of testosterone ranging from 2.5 to 500 μM as described. ΔA was determined by difference spectroscopy by using a base of 419 nm and a peak of 388 nm (type I difference spectrum). ΔAmax was determined by nonlinear regression of ΔA vs. S using the Hill (wild-type) or Michaelis–Menten (L211F/D214E) equations. Hill coefficients (n) were determined from the slopes of the linear regression lines. Data represent three independent titrations of wild-type P450 3A4 and two titrations of L211F/D214E.

