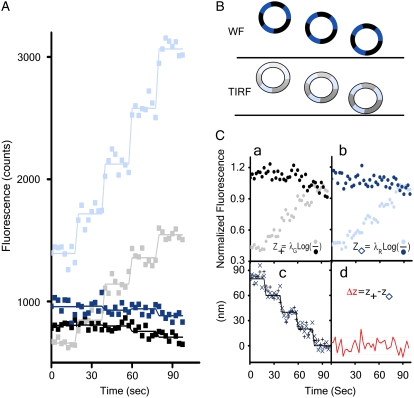
FIGURE 1.
Calibration of the evanescent field. 100 nm Tetra Speck beads (Molecular Probes) were adsorbed onto the tip of a graphite pencil as described in Methods; the pencil, mounted on a piezo device was then moved toward the glass coverslip in 20-nm steps. At the end of each step, eight consecutive TIRF and WF images were acquired, each collected simultaneously at 525/40 and 620/50 nm. (A) The fluorescence intensities of the TIRF and WF acquisitions, shown as gray and black for 525-nm and light blue and dark blue for 620-nm emission. (B) Schematic representation of the axial position of a representative bead during the experiment. (C) Analysis of bead position derived from analysis of the fluorescence data. (a and b) The normalized fluorescence intensity of the bead, with its intensities normalized to the value acquired closest to the coverslip. (c) The calculated axial position of the bead derived by Eq. 6 using the data shown in a and b. (d) Difference in bead-position fluorescence acquired for each fluorophore obtained in c as a function of the bead position along the z axis.

