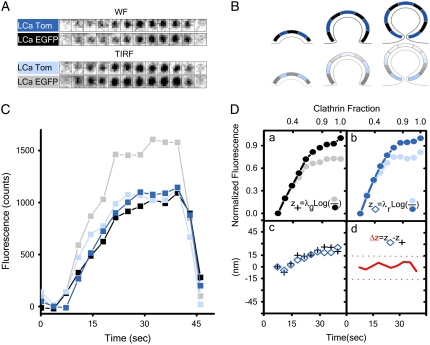
FIGURE 2.
Formation of clathrin-coated pits on the plasma membrane of cells expressing Clathrin LCa EGFP and LCa Tomato. (A) Representative fluorescence snapshots selected from Supplementary Material (Movie 1) corresponding to an individual coated pit as it assembled on the surface of the cell in direct contact with the coverslip. The panels correspond to alternating TIRF and WF images simultaneously acquired for LCa-EGFP and LCa-Tomato. (B) Model representing sequential stages during the formation of a coated pit. (C) Fluorescence-intensity plots corresponding to the coated pit shown in A. (D, a and b) Fluorescence-intensity plots for the coated pit after normalization of the TIRF and WF signals to correct for differences in the WF and TIRF illumination intensities as outlined in Methods. The traces were filtered with a (0.2,0.6,0.2) wavelet filter (Methods, Data collection). (c) The axial position measurement as a function of time corresponding to the ensemble of clathrin labeled with LCa-EGFP and LCa-Tomato derived using Eq. 5. (d) Relative axial position corresponding to the COF of LCa-EGFP with respect to that of LCa-Tomato.

