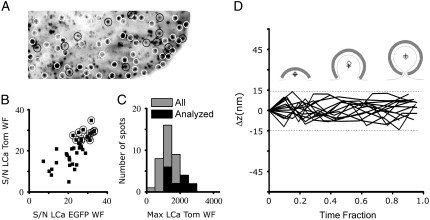
FIGURE 4.
Axial colocalization of clathrin labeled with two different fluorophores. (A) Time projection obtained from the fluorescence intensities of the coated pits as they form on the plasma membrane of BSC1 cells. The image represents the location of every pit that forms during Movie 1 of Supplementary Material. The white circles surround pits that were present at the beginning or end of the time series and were therefore eliminated from further analysis; note the absence of pits with lifetimes longer than the duration of acquisition (210 s). Red circles surround pits selected according to the criteria outlined in the text for final analysis using DiNa. (B) Plot of the signal/noise ratio (see Methods for definition) for all the pits with start and end times included in Movie 1. Pits with signal/noise values >25 in the fluorescence signal for LCa-Tomato (red circles) were selected for DiNa analysis. (C) Histogram corresponding to the maximum value in the fluorescence intensity of the LCa-Tomato signal for all the pits in B (black) and for those selected for DiNa analysis (red). The maximum fluorescence intensity reflects the size of the pit as it becomes a fully formed coated vesicle (13) (D) Difference in axial position of LCa-EGFP with respect to that of LCa-Tomato (Δz) determined for the individual pits selected for DiNa analysis. The difference of axial position within each pit is plotted as a function of time; to facilitate the comparison between pits of different lifetimes, the time component is normalized as a fraction of each lifetime.

