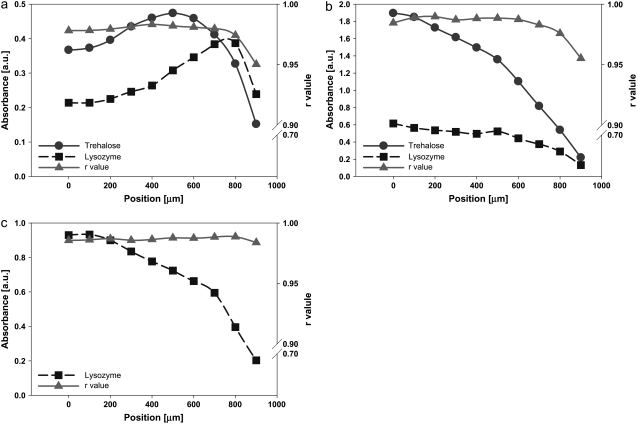
FIGURE 9.
Distribution of LYS and TRE and variation of r values within dried (a) LYS-TRE (1.0% TRE), (b) LYS-TRE (2.5% TRE), and (c) LYS-TRE (5% TRE) droplets. The droplets were dried at high humidity. X axis (position) in the figures corresponds to the radial distance from the center of the droplet.

