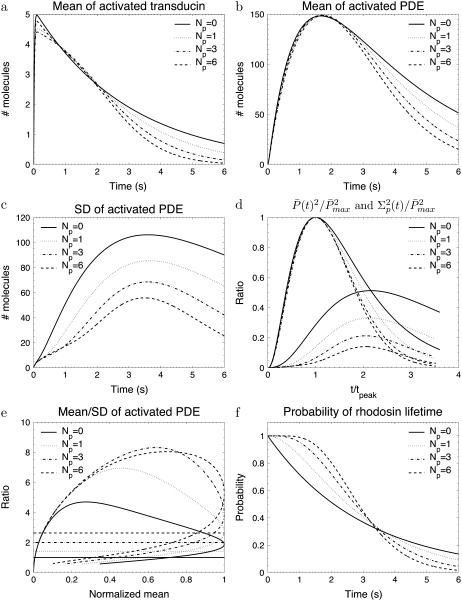
FIGURE 2.
The simulations show the impact of the number of rhodopsin phosphorylation sites for the toad rod scenario defined in Table 2. The phosphorylation dependency of the phosphorylation, arrestin binding, and transducin activation rates are given by Eqs. 48–50 with ωλ = ωact = 0.1. The rates λN and kact(N) are adapted to ensure that the rhodopsin lifetime and the maximum number of activated PDE are according to Table 2. For Np = (0, 1, 3, 6), λN and kact(N) are (0.33, 0.70, 1.6, 3.2) s−1 and (257, 228, 224, 245) s−1.

