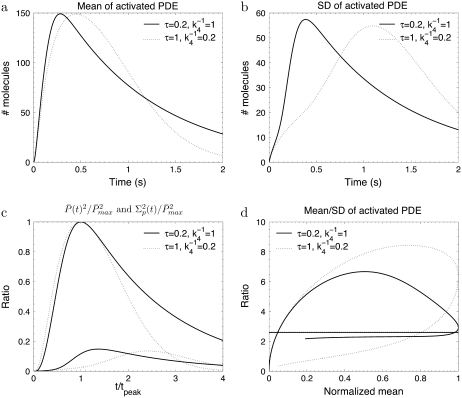
FIGURE 7.
The simulations show the impact of interchanging the lifetimes of activated rhodopsin and PDE. The phosphorylation, arrestin binding, and transducin activation rates are given by Eqs. 48–50 with ωλ = ωact = 0.1, Np = 6, k3 = 50 s−1. For τ = (0.2, 1) s, the rates λN and kact(N) are (48.2, 9.6) s−1 and (1274, 1067) s−1.

