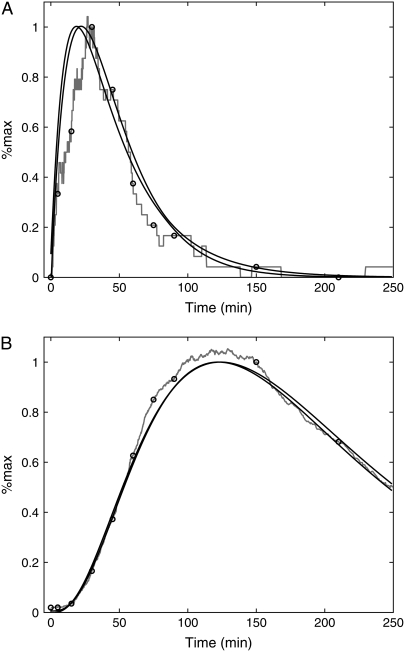
FIGURE 5.
Robustness of the inference process to intrinsic fluctuations. (A) A single stochastic realization of the mRNA level (shaded curve) and ±2 standard deviations (black curves) for the distribution of profiles estimated from the fluorescence data. The black circles are mRNA values corresponding to the sampled fluorescence levels in B. (B) A single stochastic realization of the fluorescence level (shaded curve) and ±2 standard deviations (black curves) of the distribution of estimated fluorescence profiles. The black circles are the sampled fluorescent data points used in the inference process.

