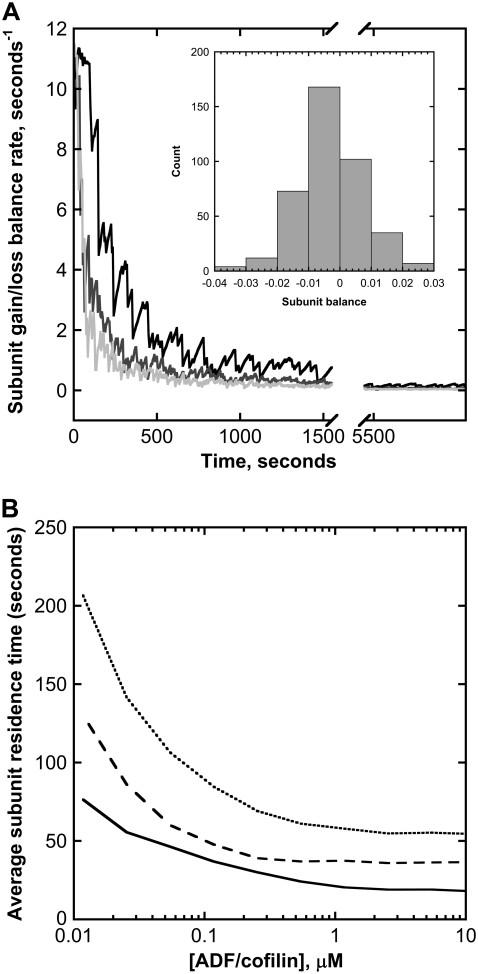
FIGURE 5.
Subunit dynamics in a single filament. (A) Variation of the subunit gain/loss balance rate. After an initial transient decrease, the net balance between gain and loss of actin subunits rapidly converges to zero, regardless of the ADF/cofilin concentration used in simulations (black curve corresponds to 0.1 μM; dark and light gray are obtained with 1 and 10 μM, respectively). (Inset) Net balance fluctuation histogram determined over the last 2000 s of simulations. (B) ADF/cofilin-severing activity controls the average time spent by a subunit in actin filaments (solid black curve) and in the different fragments generated by the same filament (dashed black curve). The average duration of a life cycle (monomer to filament to monomer) is given by the dotted black curve. Parameters for simulations are listed in the legend of Fig. 2 B.

