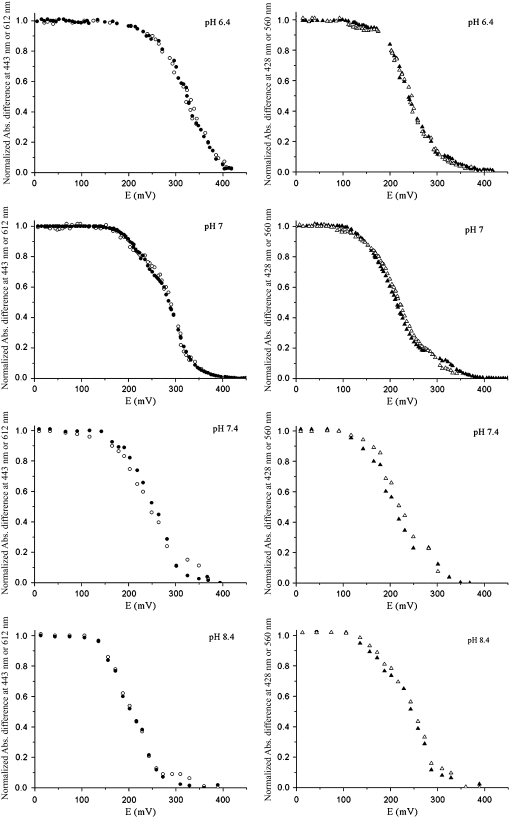
FIGURE 4.
Reductive redox titrations at pH 6.4, 7, 7.4, and 8.4 of the ba3 oxygen reductase from T. thermophilus monitored by visible spectroscopy. On the left are data obtained for the high-spin heme, and on the right for the low-spin heme. Data were collected at 443 (•) and 612 nm (○) for heme A3 and at 428 (▴) and 560 nm (Δ) for heme B.

