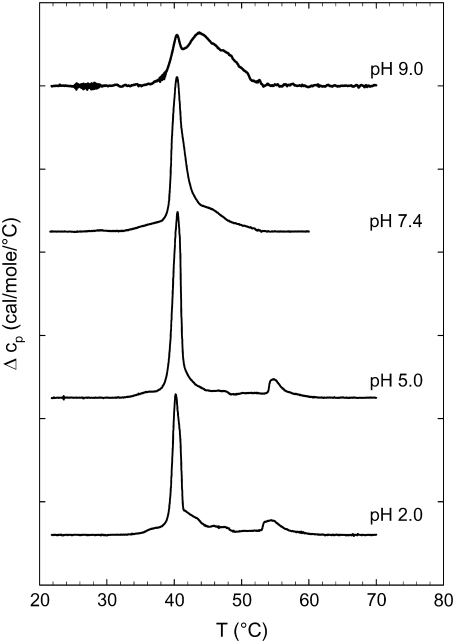
FIGURE 2.
DSC heating scans for lysyl-DPPG at various pH values. Data taken from the first heating scans with a scan rate of 0.5°C/min. Heat capacity curves for pH 9.0, pH 7.4, pH 5.0, and pH 2.0 (top to bottom) were shifted horizontally for better graphic representation. The arrows indicate the pretransition.

