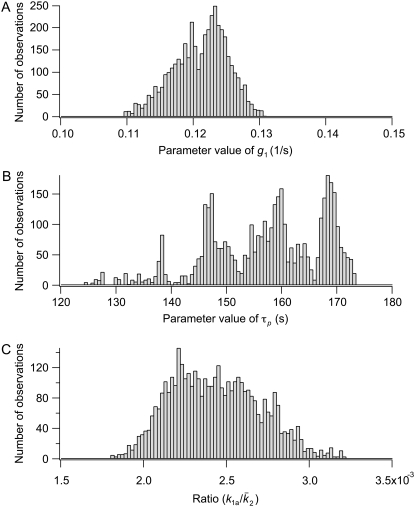
FIGURE 10.
Representative parameter distributions obtained from MCMC. (A) A typical parameter distribution with a clear preferred parameter value. (B) A typical parameter distribution with more than one peak. A mean and variance is not a useful characterization of this distribution, but the 95% confidence interval still tells us the most likely range for the parameter. (C) The ratio of parameters that show correlations has a clear preferred value.

