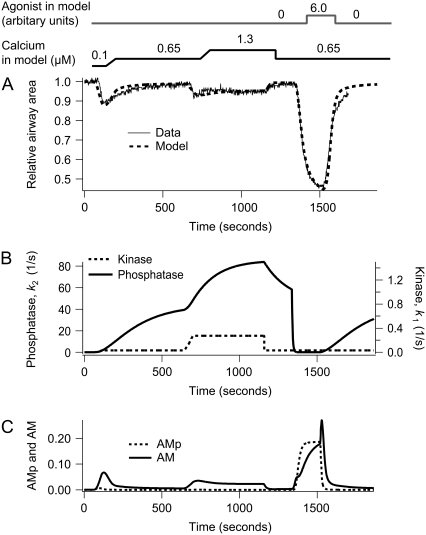
FIGURE 3.
Contraction of airway SMCs in response to step changes in sustained high [Ca2+]i (c) in the absence and presence of agonist (a). (A) Experimental data (solid) with the model fit (dashed). (B) The corresponding MLCP (k2) and MLCK activity (k1) induced by changes in c and a. (C) The corresponding fractions of AM and AMp. The simulation was done by changing c as follows: c = 0.1 μM for 1 min, c = 0.65 μM for 10 min, c = 1.3 μM for 8 min, c = 0.65 μM for the remaining time. To simulate the experimental change in c, every step increase in c required 1 min to reach the next level of [Ca2+]i. The agonist concentration a is increased from 0 to 6.0 after 22 min.

