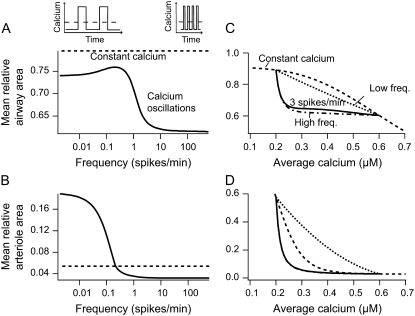
FIGURE 8.
Frequency response. (A and B) Frequency dependency of the contractile response of airway and arteriole, respectively, to calcium oscillations with a constant average [Ca2+]i. The steady-state mean relative area over one period (solid line) varies between two limit cases for low- and high-frequency oscillations (see Appendix). High-frequency oscillations give a strong contractile response. The mean average calcium is maintained at 0.4 μM by varying the spike width together with the period so that their ratio is 0.5 (upper inset). Agonist is kept constant at a = 1.2. (C and D) Contractile response of airway and arteriole to calcium oscillations with different average [Ca2+]i. The average [Ca2+]i varies from 0.2 to 0.6 μM by changing the ratio of spike width to period. For comparison the area obtained with a constant signal of equal average is shown (dashed line). The dot-dashed and dotted lines give the mean area for the limit cases at low- and high-frequency oscillations, respectively (see Appendix). Basal and peak [Ca2+]i are 0.2 and 0.6 μM, respectively.

