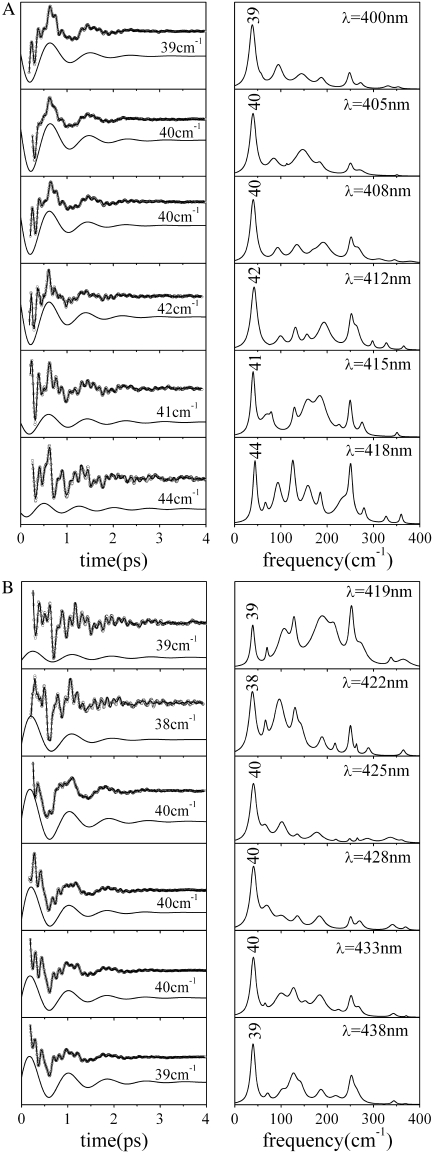
FIGURE 4.
FCS spectra of MbCN as a function of excitation wavelength between 400 and 418 nm (A) and between 419 and 43 8nm (B). The left panels show the oscillatory signals and the LPSVD fits, with the component associated with the mode near 40 cm−1 displaced below. The right panels show the corresponding power spectra. The excitation wavelength is shown in the upper-right corner of each panel.

