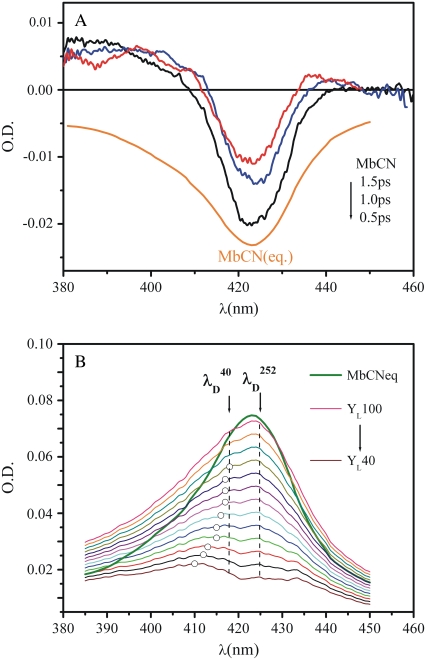
FIGURE 9.
(A) Transient continuum absorption measurements (0.5 ps, 1.0 ps, 1.5 ps) of MbCN taken using a 580 nm pump wavelength. The equilibrium absorption spectra of MbCN is presented for reference because it corresponds to the bleaching component of the transient signal. The continuum spectra were gently smoothed using a Fourier filter to remove high-frequency noise. (B) A series of product state line shapes found by addition of the scaled equilibrium MbCN absorption to the transient difference spectrum at 0.5 ps. Different scaling assumes different amounts of ligand photolysis. The resulting photoproduct line shapes are subsequently fitted with a sum of two Gaussian functions: one, corresponding to the hot six-coordinate MbCN species is allowed to have variable amplitude but the peak wavelength is held fixed at 425 nm with a FWHM = 31 nm. The other, corresponding to the photolyzed material, is allowed to vary all parameters (amplitude, central wavelength, and FWHM). The open circles correspond to the central wavelength of the fitted photoproduct band. The dashed lines at 418 nm and 425 nm correspond to the minima of the 40 cm−1 and the 252 cm−1 coherence amplitudes as obtained from the FCS data. These positions correspond to the peaks of the underlying Soret resonances that couple to the respective modes. The equilibrium spectrum of MbCN is also displayed as a solid green curve for reference.

