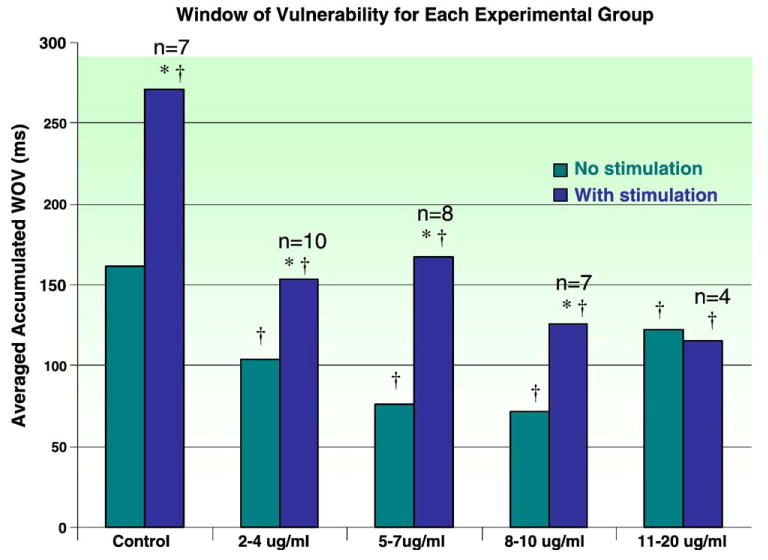
Fig. 1.

Bar graph presentation of the average cumulative WOV for each experimental group with different serum levels of caffeine compared with the control group. The first bar in each group represents the average WOV determined without GP stimulation; the second bar depicts the average WOV due to premature depolarization from the PV with concomitant stimulation of the GP. Statistical comparison were made within groups (*P < .05, stimulation compared with no stimulation) as well as between each experimental group compared with the control group (†P < .05, compared with control).
