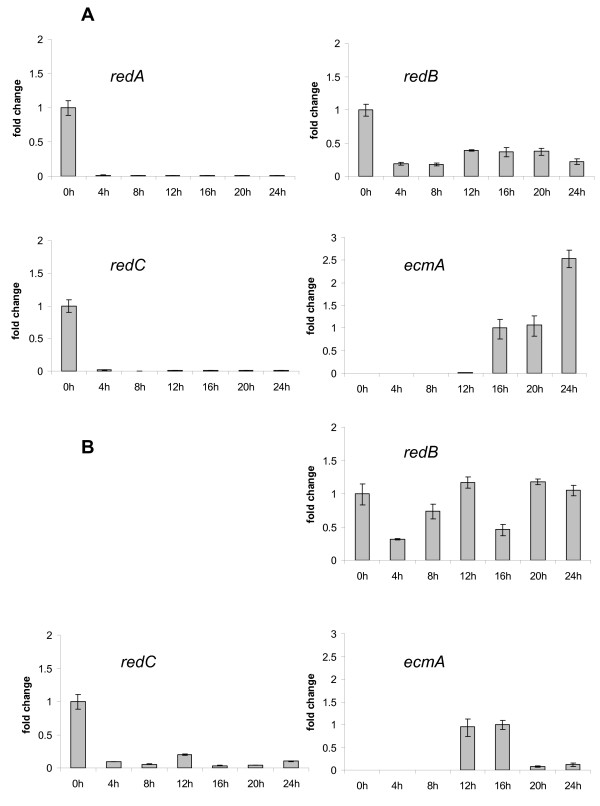
Figure 3.
Transcriptional profile of redA, redB, redC and ecmA. Exponentially growing AX4 (A) and redA- (B) cells were starved on filter pads and harvested at the indicated times (h) after starvation. Transcript levels for redA, redB and redC genes are relative to 0 h cells. Fold change for ecmA are relative to transcript levels detected at 16 h. Error bars represent the standard deviation from two independent experiments where qPCR assays were performed in triplicate.

