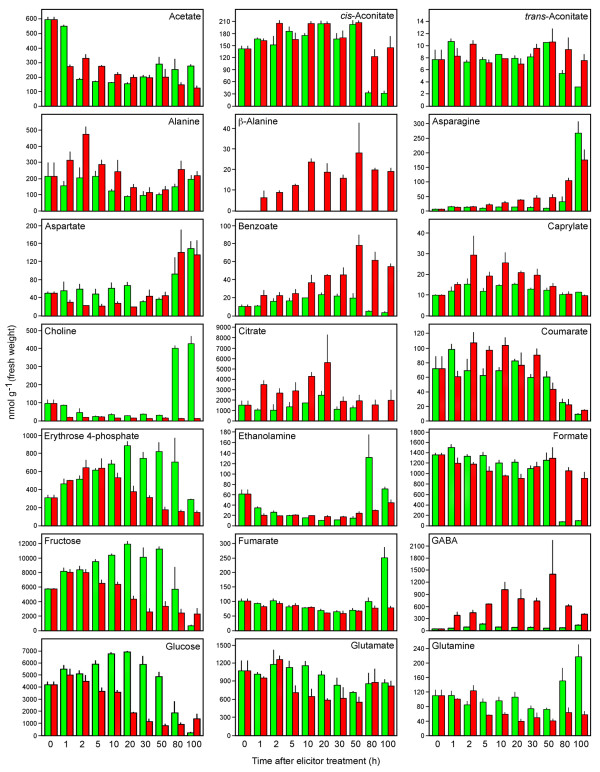
Figure 7.
Quantification of identified metabolites (acetate to glutamine, alphabetically) in control (green) and elicitor-treated (red) opium poppy cell cultures at different time points post-elicitation. Data are given as means ± SEM, which were calculated using three biological replicates. Quantification was achieved using Chenomx NMR Suite v. 4.6 with DSS as the internal standard.

