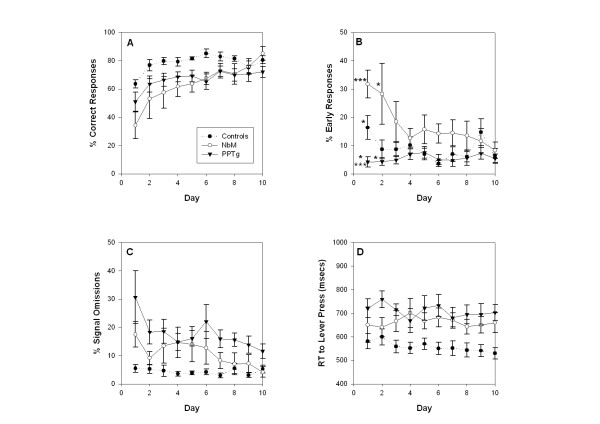
Figure 2.
Mean (+/- SE) performance of lesion and control animals in the sustained attention task over post-surgical days 1–10. The 4 panels show: A – Percent correct responses (response to bright light), B – Percent early responses (response to dim light), C – Percent signal omissions, D – Latency to lever press on a correct response. Full statistical analysis appears in the text. There were significant effects of day on signal omissions and correct responses suggesting an element of relearning following lesion surgery. PPTg lesioned animals made significantly more signal omissions (p < 0.001) and had significantly longer latencies (p < 0.005) compared to controls. NbM lesioned animals showed reduced correct responses (p < 0.05) and longer latencies (p < 0.05) compared to controls. Significant group × day interactions were found only in relation to early responses and are depicted in panel B: on day 1 there were significant differences between the PPTg group and controls (* p < 0.05) and between PPTg and NBM groups (***p < 0.001); on day 2 the PPTg group were significantly different to the NBM group (*p < 0.05).

