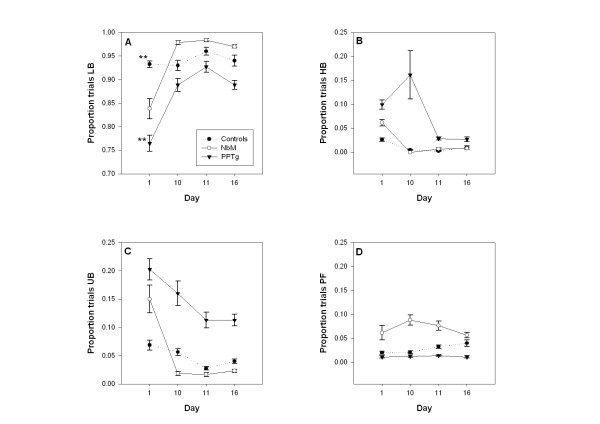
Figure 4.
Mean (+/- SE) proportion of trials on which coded behaviours were observed in the video footage. Data are taken from days 1, 10, 11, 16. The 4 panels show: A – Bright light lever orientation (LB), B – Bright light houselight orientation (HB), C – Expression of unconditioned behaviours during the bright light (UB), D – Lever pressing failures (PF). Full statistical analysis appears in the text. PPTg lesioned animals had reduced bright lever orientation on day 1 compared to controls (p < 0.01) and showed significantly increased houselight orientation with increased unconditioned behaviours. NbM lesioned animals showed only increased lever pressing failures compared to PPTg lesioned animals (p < 0.05). Only the data for lever orientation to the bright light (panel A) showed a significant group × day interaction. On the first day, there was a significant difference between the PPTg lesioned group and the control group (** p < 0.009).

