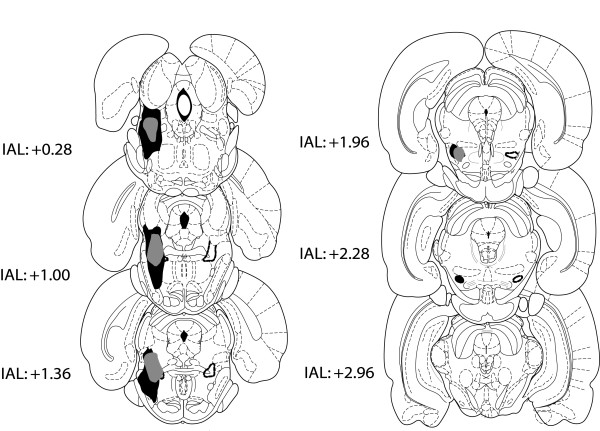
Figure 5.
A representation of ibotenate lesions of the PPTg included in the data analyses. The largest lesion is shown in black and the smallest in grey. The location of the PPTg is indicated by a dashed black outline on the right of the diagrammatic sections. Distance is given from the interaural line in mm.

