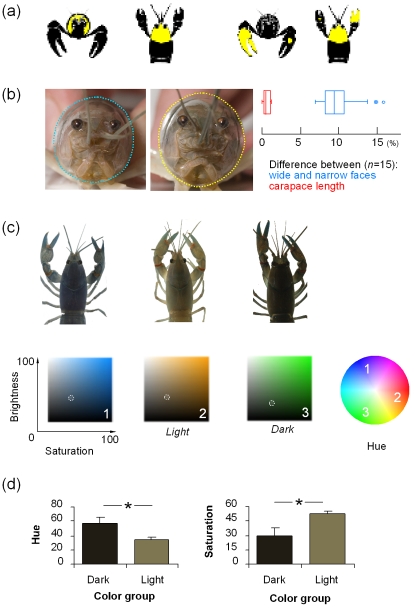
Figure 2. Manipulating visual clues.
Testing artificial paint patches (a), facial width (b) and color of the facial region (c–d) for a recognition response in C. destructor. (a) Images of crayfish painted in the face region (left) and chelae (right) from the front and top perspectives. Two paint experiments are shown on the chelae images: the chelae experiment and the small paint patch (control 2). Chelae paint was applied to both chelae (only one shown) and to the dorsal and ventral surfaces (only dorsal shown). (b) A narrow- and a wide-faced crayfish were placed at either end of the choice arena. Left panel shows an example of a “narrow” and “wide” face (8% wider, scale: square face panels 2×2 cm). The box plots (right panel) summarize the difference in facial width (blue) between the narrow and wide stimulus crayfish in one experiment and the small difference between their carapace lengths (red). (c) Different colored crayfish were placed at the ends of the choice arena. To make the distinction between crayfish, three color elements were measured: hue (color, as depicted by a color wheel-shown left), saturation (intensity) and brightness (lightness or darkness). The three partial crayfish pictured show the range of color variation we measured in C. destructor. The color swatches (1 to 3) beneath each crayfish image represent the saturation and brightness of color on a scale of 0–100% that were measured for that crayfish image; the hue for each image is shown on the color wheel to the right. (d) When color was varied, the stimulus crayfish were grouped into a “light” and a “dark” color, judged by human eye and confirmed by analysis. Crayfish images 2 and 3 in (b) represent the means of the hue and saturation of the light and dark groups. Brightness was not used to judge crayfish different because this is dependant on the available light. Graphs show difference between the stimulus crayfish for hue and saturation (mean±s.e.m, *significantly different t test p<0.05 and also visibly different by human eye as confirmed by naïve observers asked to group the crayfish images by color). Images were photographed under standardized conditions in a studio.

