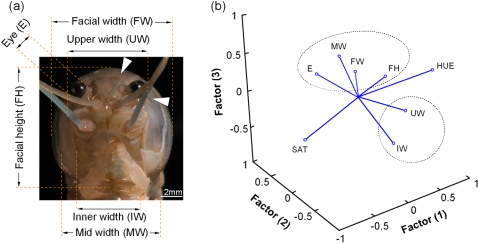
Figure 3. The face of C. destructor.
(a) Photo of the features analyzed on C. destructor's face. Color hue and saturation were taken from the mean of 5 points (white triangles are 2 example locations). (b) PCA factor analysis of 8 facial features of C. destructor. Two clusters are identified by dotted circles and the color variables (HUE–color, SAT–saturation) occur at the extremes of the plot and outside these clusters. Facial width (FW) and color (SAT, HUE) do not plot together indicating that their variation is different.

