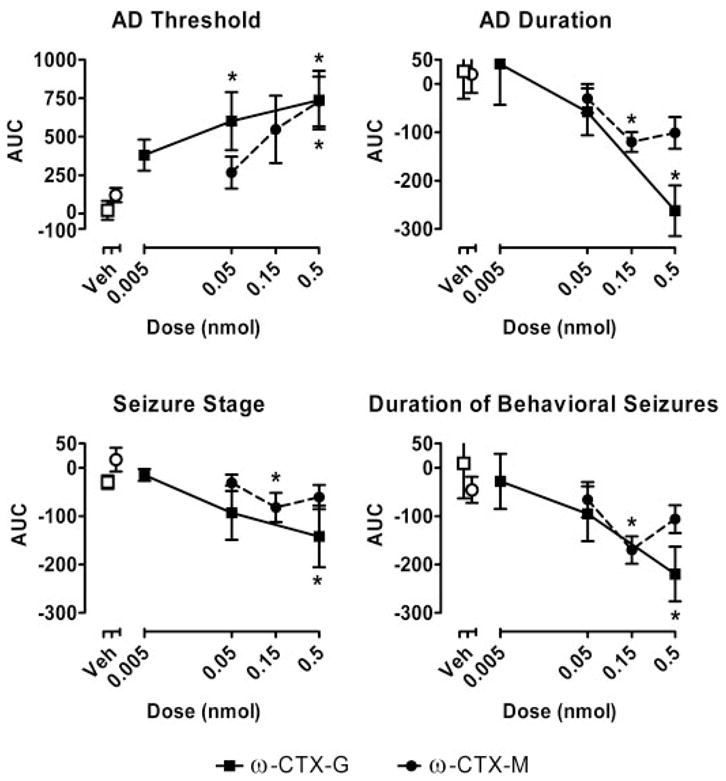
Fig. 4.

Area-under-the-curve analysis of the data from Figs. 2 and 3. The area under the curve of the percentage of change values for the period 20 min to 1 week following infusion for every time course data set in each animal was determined using the trapezoidal method. The data points represent the mean ± S.E.M. of the values (in percent-days) for all animals receiving a specific toxin and dose. Open squares (□) and circles (○) indicate control values for the group of animals tested with ω-CTX-G (■) and ω-CTX-M (●), respectively. *, significantly different from corresponding vehicle value at that dose (Tukey’s test) following the detection of a statistically significant main effect by a two-way repeated measures ANOVA.
