
Fig 1.
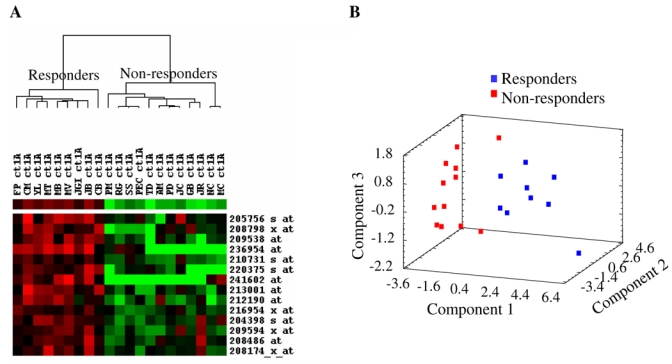
Analysis of gene signature by (A) unsupervised clustering and (B) principal component analysis (PCA). (A): column represents sample, and row represents gene. Red indicates relative high expression and green relative low expression. (B): PCA involves a mathematical procedure that represents the maximum of the data information by reducing the space dimension. Here 80% of the information was explained with the three principal components used in the graph.