
Figure 2.
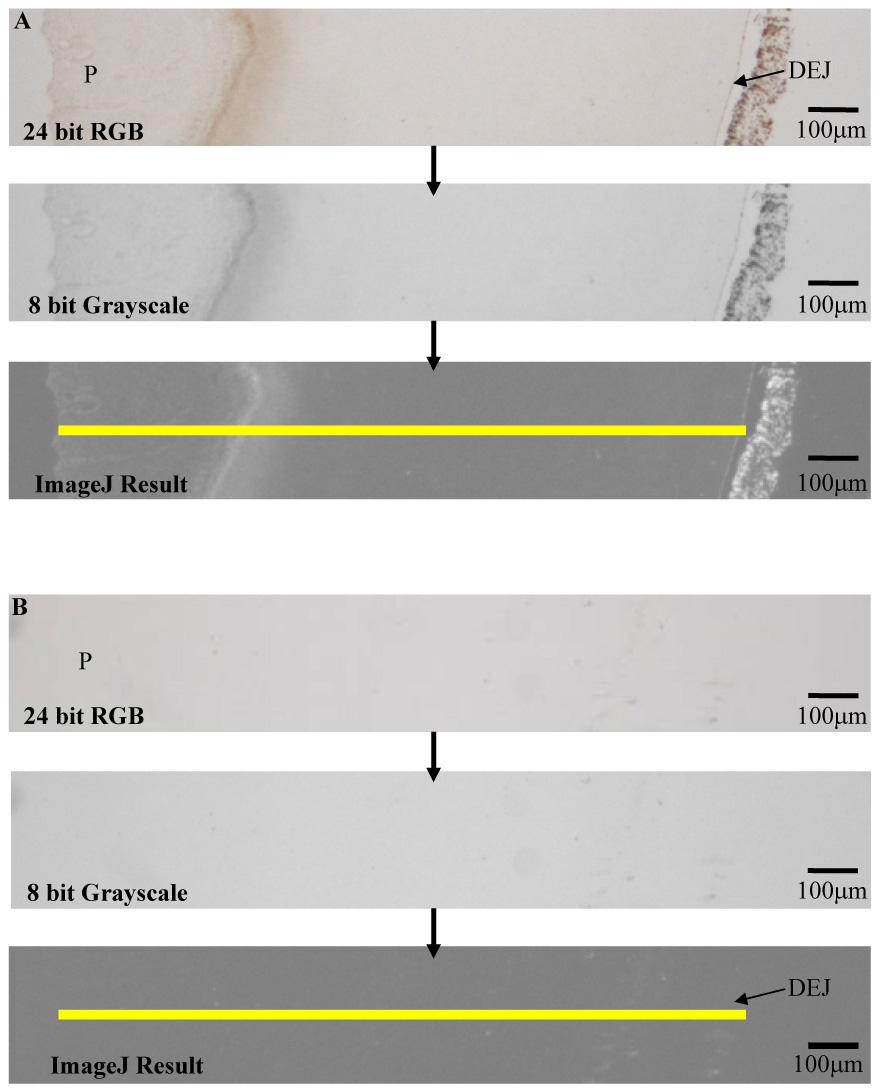
Example of RGB to grayscale image processing. The yellow line represents a one pixel wide region from pulp (P) to beyond the dentinoenamel junction (DEJ). The grayscale level at every pixel along this line was measured to develop an analysis plot of MMP-2 immunoreactivity. Sections were probed with α-MMP-2 (A) or Control (B) No counterstain was used.