
FIGURE 4.
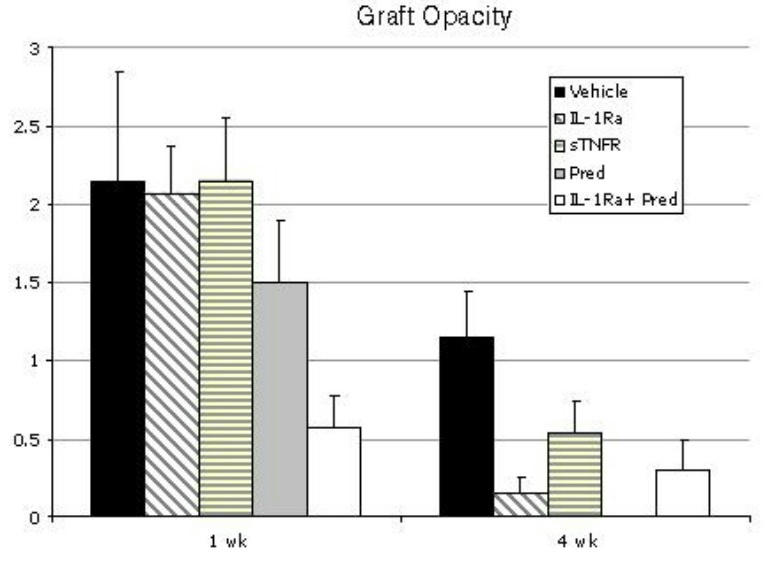
Mean corneal transplant opacity scores among 5 different treatment groups at 1 and 4 weeks postkeratoplasty. At 1 week, maximal suppression in graft opacity is observed with combined IL-1Ra and Pred therapy. By 4 weeks, all treatment regimens demonstrate significantly lower opacity scores as compared to the vehicle-treated group. Bars represent standard error of the mean.