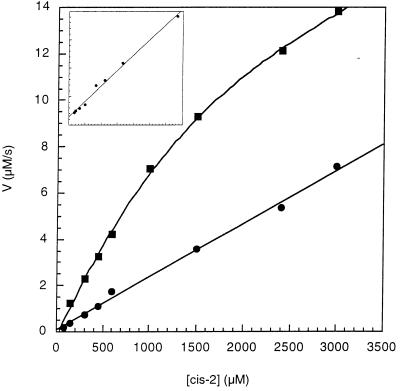
Figure 2.
Plot of reaction velocity versus substrate concentration for the cis to trans isomerization reaction of 2. Initial velocities were calculated from progress curves measured at 0°C in 50 mM Hepes/50 mM NaCl, pH 7.8 buffer containing 2% TFE, in the presence of 7.0 μM antibody 47 Mar.1 (▪) and in the absence of a catalyst (•). (Inset) The corresponding Lineweaver–Burk plot for the antibody-catalyzed isomerization reaction.

