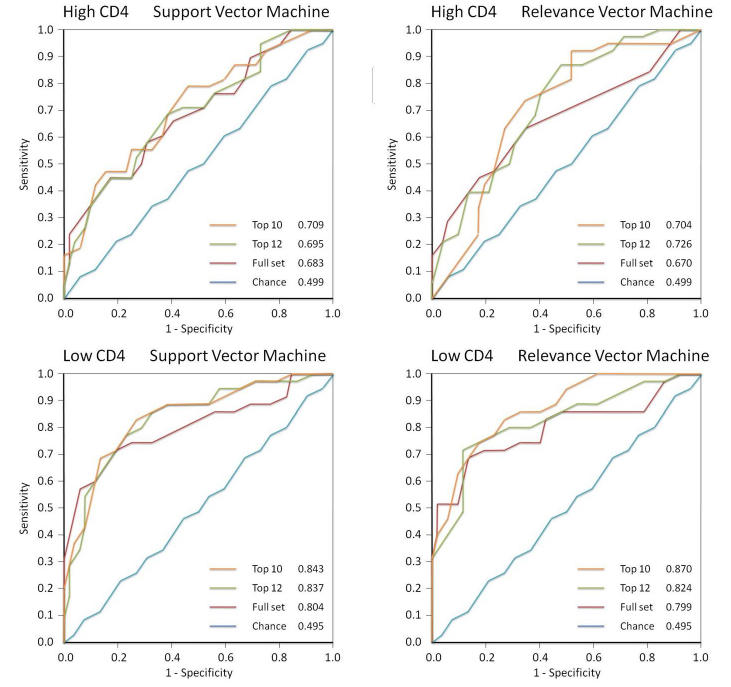
FIGURE 1.
Receiver operating characteristic curves for support vector machine, relevance vector machine, high CD4, and low CD4. Within each graph are curves generated for machine learning classifiers trained to distinguish HIV eyes from normal eyes using all 52 field locations, the subset with peak performance, and the 10-location feature set; the chance curve is the attempt to learn classes with equivalent data.

