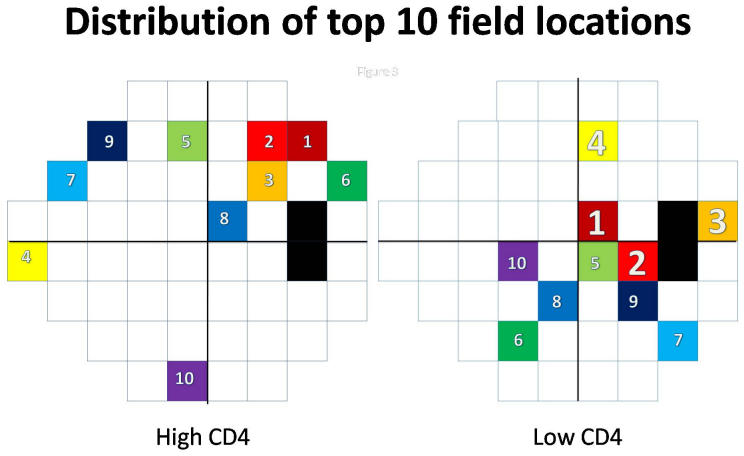
FIGURE 3.
Plot of the 10 best features in combination, from backward elimination. In the high-CD4 eyes, small sets did not perform well, indicating uncertain distribution of the top features (small numbers). In the low-CD4 eyes, feature sets larger than 4 did not improve performance, indicating the top 4 field locations (large numbers) were strong predictors of HIV.

