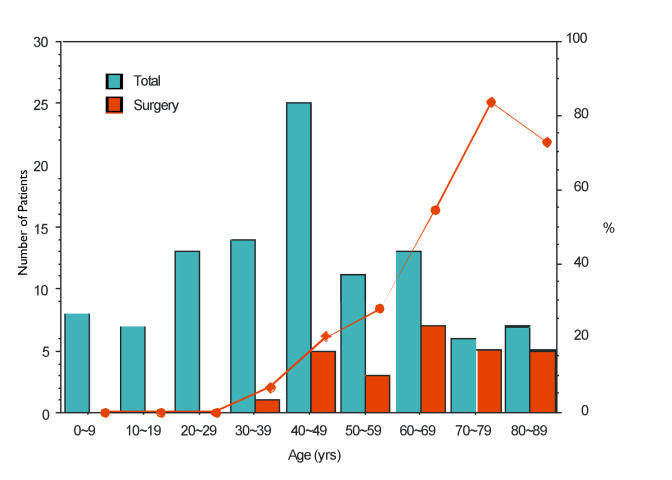
FIGURE 25.
Age vs corneal surgery prevalence in Schnyder crystalline corneal dystrophy.(SCCD). Left y-axis represents number of patients, right y-axis represent percentage of patients. X-axis represents decade of age in years (yr) on most recent contact. Blue columns represent total number of patients in each decade of age. Red columns represent number of patients reporting prior corneal surgery on the most recent contact. Red line indicates percentage of patients in each decade of age with history of corneal surgery.

