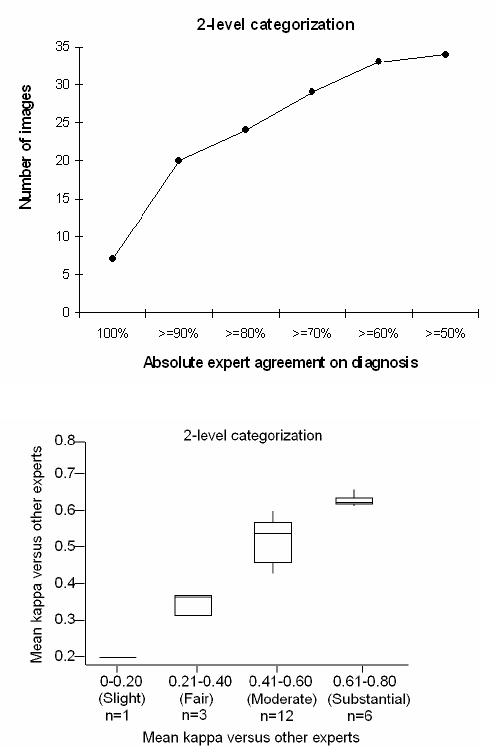
FIGURE 3.

Inter-expert agreement in plus disease diagnosis among 22 experts reviewing 34 retinal images. Top, Percentage of experts who assigned the same diagnosis (“plus” or “not plus”) to images. Bottom, Box plot of mean kappa statistic for each expert compared to all others. Boxes represent the 25th, 50th, and 75th percentile kappa values; whiskers represent 10th and 90th percentile values.
