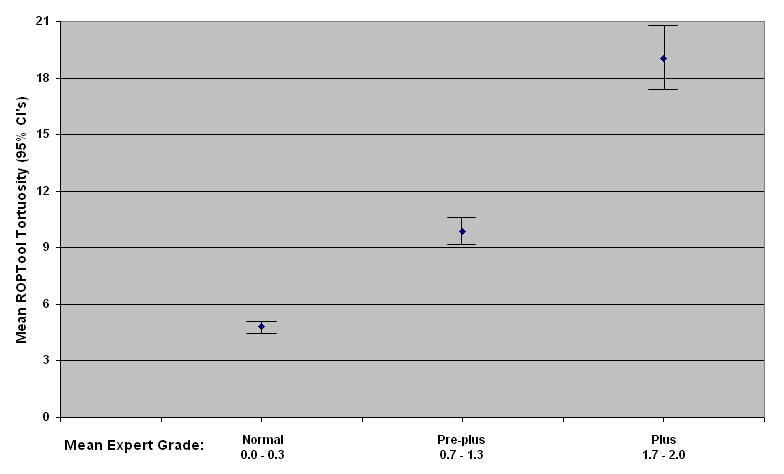
FIGURE 10.

Mean quadrant tortuosity (and 95% confidence intervals [CI]) measured by the computer program (ROPtool) for 3 levels of mean expert grade. Three experts graded the tortuosity of each quadrant of images of premature infants’ retinal blood vessels as 2 = plus disease, 1 = pre-plus disease, and 0 = normal.
