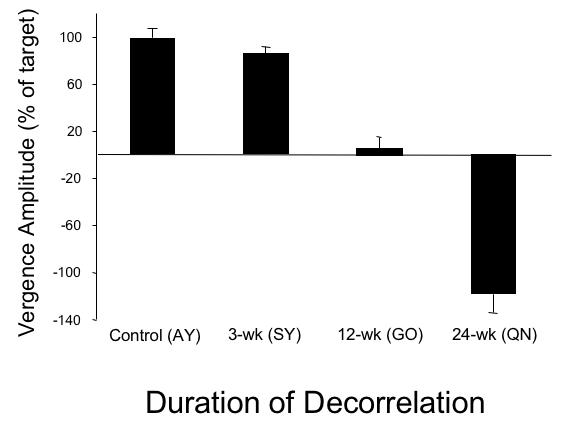
FIGURE 19.

Accommodative-disparity convergence amplitude as a percentage of target step to the near position. The control and 3-wk monkey had comparable responses. The 12-wk monkey showed a subnormal response; the 24-wk monkey showed an even weaker response. Mean ± SD.
