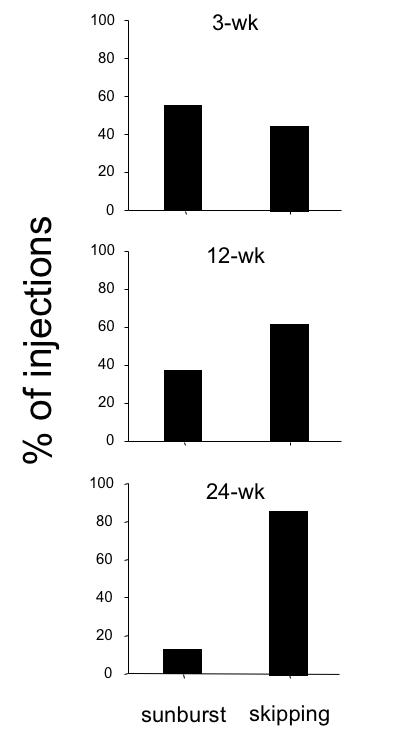
FIGURE 26.

Proportion of V1 injections that corresponded to “sunburst” (binocular) vs “skipping” (monocular) patterns of transported label in the 3-wk, 12-wk, and 24-wk monkeys. Pooled data within groups for multiple injections into both V1 hemispheres.
