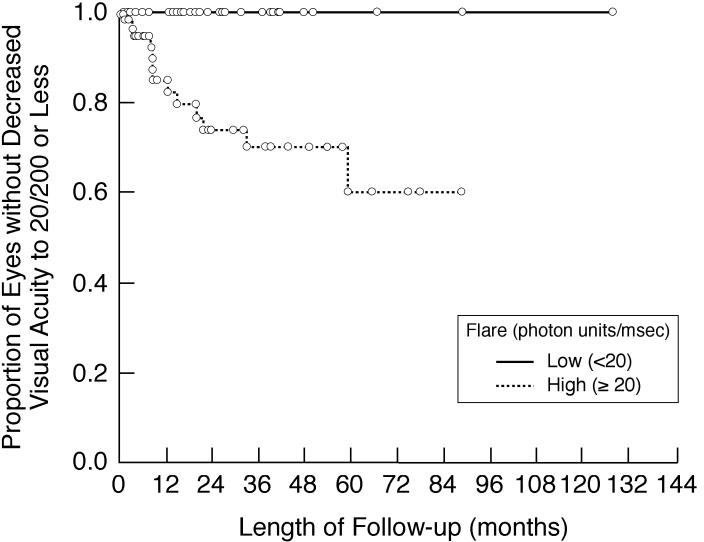
FIGURE 8.
Kaplan-Meier analysis showing the proportion of involved eyes of children with chronic anterior uveitis that are without decreased visual acuity to 20/200 or less during follow-up after initial flare determination. Shown are subgroup analyses based on baseline/first flare value (<20 pu/msec vs 20 ≥pu/msec).

