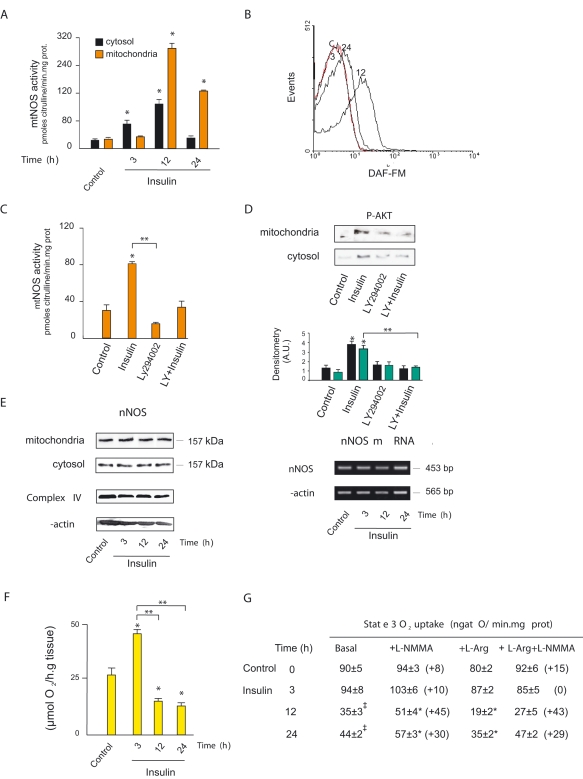
Figure 2. Insulin-PI3K signaling triggers high mitochondrial NOS activity.
(A) Time-course of mitochondrial NOS activity after insulin administration measured by 3H-L-citrulline formation (n = 8; cytosol: F = 30.62, DF = 31, P = 0.000; mitochondria: F = 290.84, DF = 31, P = 0.000). (B) Matrix NO level appraised by DAF-FM fluorescence by flow-cytometry of isolated mitochondria; fluorescence was selectively analyzed in a mitochondrial population delimited by previous incubation with Mito Tracker Red 580 (C) mtNOS activity of mitochondria isolated from 200 mg of muscle slices preincubated by 30 min with 12 nM of insulin or 100 µM of LY29400 (PI3K-specific inhibitor) (F = 38, DF = 27, P = 0.000). (D) Representative western blot of muscle p-Akt2 distribution under the same conditions as in C. (cytosol: F = 14.75, DF = 15, P = 0.000; mitochondria F = 13.63, DF = 15, P = 0.000). (E) Expression of mtNOS and nNOS mRNA assessed by western blotting and RT-PCR, under the same conditions of Figure 1. (F) Polarographic determination of oxygen uptake of 100 mg of sliced gastrocnemius and extensor digitorum longus muscles obtained after insulin administration in Robinson buffer with 5 mM of glucose as substrate, pH 7.4 (n = 6; F = 18.32, DF = 22, P = 0.000). (G) State 3 oxygen uptake of mitochondria isolated from muscles was measured under the same conditions with malate-glutamate and ADP at 30°C in MSHE buffer, pH 7 and in the presence of L-NMMA, L-Arg alone or together with NOS inhibitor L-NMMA (n = 3–12; 12 h: F = 13.83, DF = 15, P = 0.000; 24 h F = 15.69, DF = 37, P = 0.000, *P<.05 vs respective basal values by Dunnett posthoc test; basal control and insulin-treated groups: F = 45.21, DF = 23, P = 0.000, ‡ P<.05 vs control by Dunnett posthoc test). In brackets, the percentage of variation respect to basal or L-arginine, respectively.

