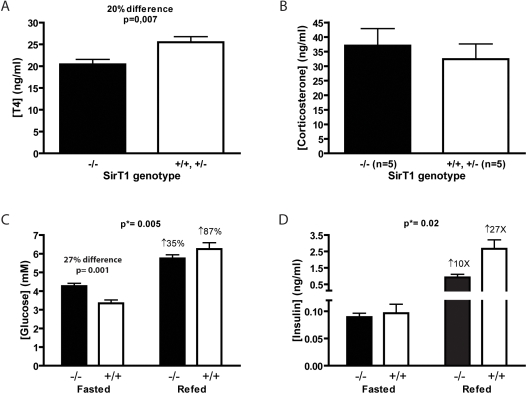
Figure 3. Serum thyroxin (T4), corticosterone, glucose and insulin levels.
A. T4 levels were measured from serum samples of SirT1-null and normal mice using an EIA kit. B. Corticosterone levels were measured from plasma samples of SirT1-null and normal mice at 4 hours intervals during the diurnal cycle using an EIA kit. The peak values are plotted. Unpaired T-tests were performed to assess statistical significance. Blood glucose (C) and insulin (D) levels of 2–3 months old mutant and wild type mice were measured after 24 hour fasting and again 3 hours after refeeding using a standard glucometer (C) and an ELISA kit (D). Means and standard errors are represented. Two-way ANOVAs was performed to assess statistical significance of interaction between genotype and dietary condition (p*-values on top of panel), and unpaired T-test to assess difference between genotypes within dietary condition groups (p-value over bars).

