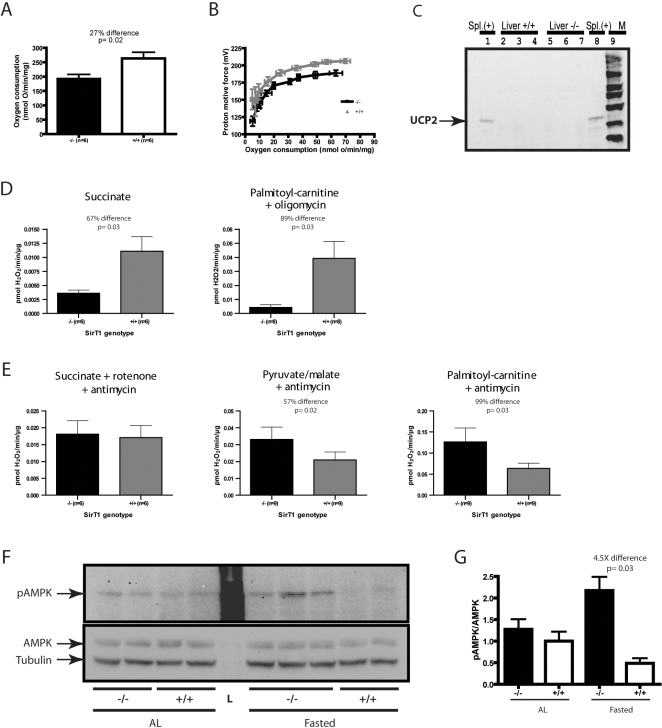
Figure 6. Respiration and ROS production of isolated mitochondria.
A. State 3 oxygen consumption rate of liver mitochondria from SirT1-null and normal mice was determined using succinate, in the presence of rotenone. Proton motive force (PMF) was determined in liver mitochondria (B) using succinate, in the presence of rotenone and a saturating amount of oligomycin. The farthest point on the right represents the maximal state 4 oxygen consumption rates. The kinetic response of PMF was determined by inhibiting respiration targeting complex II by incremental additions of malonate (up to 5 mM). C. Western blot of UCP2 from liver mitochondria. Thirty µg of mitochondria-enriched proteins from normal spleen (Spl., positive control) or liver from 3 different SirT1-null and normal mice were loaded separately in each lane, electrophoresed, blotted and probed with an antibody to UCP2. Note that UCP2 protein expression is not de-repressed in mutants. D–E. ROS production from liver mitochondria was measured using the p-hydroxyphenylacetate (PHPA) assay using the substrates and respiration inhibitors indicated at the top of each column. F. Western blot of phospho-AMPKα (pAMPK), AMPα (AMPK), and α−tubulin. Hundred-fifty µg of liver proteins from 2–3 different SirT1-null and normal mice under the indicated dietary condition was loaded separately in each lane, electrophoresed, blotted and probed with an antibody to pAMPK. Membrane was stripped and reprobed sequentially with antibodies to AMPK and α−tubulin. G. Densitometry of western blot signal in F. Bands in F were quantified by densitometry using the ImageJ software. Means and standard errors are represented. Unpaired (A, G) or paired (D–E) T-tests were performed to assess statistical significance (see Materials and Methods).

