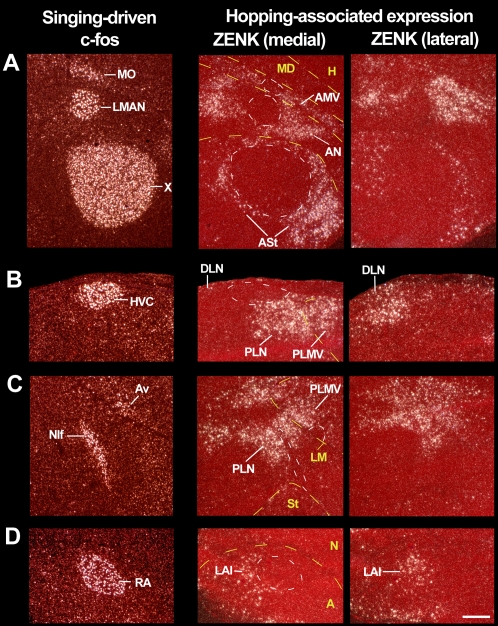
Figure 7. High power images of IEG activation in zebra finch vocal nuclei during singing and in adjacent movement-associated areas during hopping.
(A) Anterior vocal nuclei adjacent to ASt, AN, and AMV. (B) HVC adjacent to DLN and dorsal PLN. (C) NIf and Av adjacent to ventral PLN and PLMV respectively. (D) RA adjacent to LAI. The c-fos expression in vocal nuclei (first column) is of a young zebra finch male that sang for 30 min while moving relatively little; c-fos is shown for its high contrast in vocal nuclei relative to the surrounding non-vocal areas. The hopping-associated expression (left two columns) is from a male that hoped in the dark and was deaf; the left most sections are lateral to the vocal nuclei (except for anterior areas, which still contain the lateral part of the anterior vocal nuclei). Yellow dashed lines-brain subdivision boundaries; white dashed lines–vocal nuclei boundaries, only highlighted for some images so that other sections can be viewed as is. Anterior is right, dorsal is up–sagittal sections; sections of the top panel are orientated at a ∼45° angle so that all three anterior vocal nuclei fit vertically into one image. Scale bar, 200 µm.

