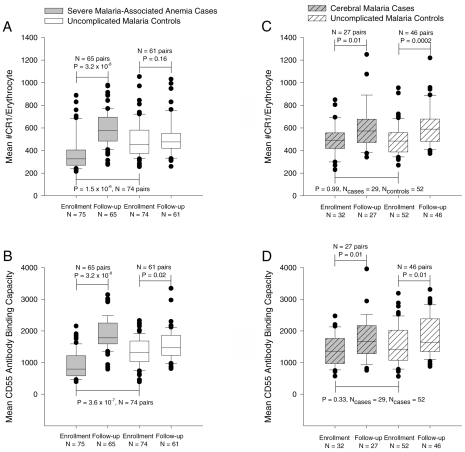
Figure 1.
CR1 and CD55 expression on red cells of children with SMA, CM, and their age and gender-matched controls. Data are presented as box plots using all the available values, where the boundary of the box indicates the values between the 25th and 75th percentiles, a line within the box marks the median, and the whiskers indicate the 90th and 10th percentiles. The outlying points are represented as dots. P values for the comparisons between cases at enrollment with cases at follow-up and controls at enrollment are based on matched analysis using Dunnett’s test for multiple comparisons. P values for the comparison between controls at enrollment and follow-up are based on a paired t-test.

