Figure 6.
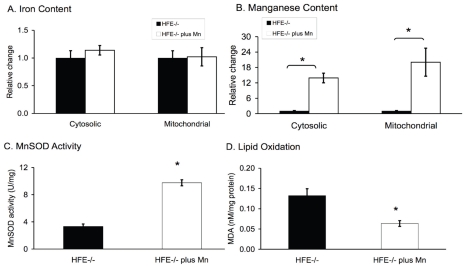
Manganese supplementation reverses mitochondrial phenotype of the Hfe−/− mice. Liver cytosolic and gradient-purified mitochondrial preparations were isolated from Hfe−/− mice that either were mock controls or manganese-treated [plus Mn]. Figures show contents of cytosolic and mitochondrial iron and manganese from Hfe−/− mice [plus Mn] (hatched bars) presented as the percent change in [plus Mn] Hfe−/− mice compared with controls (open bars). A. Iron content in cytosolic and mitochondrial preparations from Hfe−/− mice [plus Mn] displayed no changes compared with mock-treated Hfe−/− mice. Actual iron values were: cytosol, 24.7 ± 1.9 nmol iron/mg protein for [plus Mn] mice compared with 21.7 ± 2.9 for controls; mitochondria, 13.6 ± 2.2 nmol iron/mg protein for [plus Mn] mice compared with 13.4 ± 1.7 for controls; P = NS; n = 4–6 determinations/group). Values are represented as the mean ± SEM. B. Manganese supplementation caused significant manganese accumulation in cytosolic and mitochondrial preparations in [plus Mn] Hfe−/− mice compared with controls. Actual manganese values were: cytosol, 0.4 ± 0.06 nmol Mn/mg protein for [plus Mn] mice compared with 0.03 ± 0.007 for controls, in mitochondria, 1.62 ± 0.4 nmol Mn/mg protein for [plus Mn] mice compared with 0.08 ± 0.02 for controls; *P < 0.001; n = 4–6 determinations/group). C. Manganese supplementation increases activity of mitochondrial MnSOD in Hfe−/− mice compared with controls (9.76 ± 0.45 vs. 3.34 ± 0.35 unit SOD/mg protein, 7–9 mice/group; *P < 0.001). D. Manganese (plus Mn) supplementation reduced TBARS levels in Hfe−/− mice compared with untreated controls (0.06 ± 0.01 compared with 0.13 ± 0.02, 6–8 mice/group; *P < 0.01).

