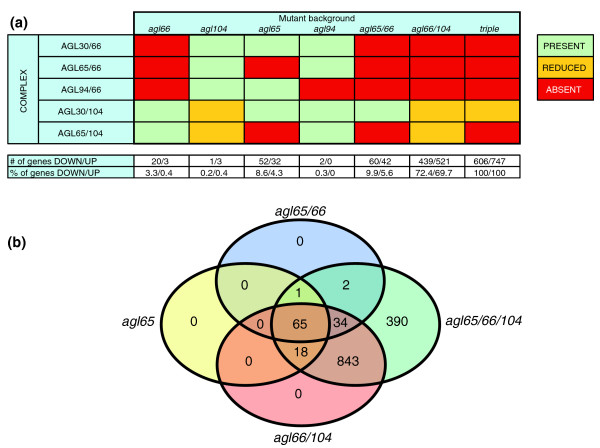
Figure 2.
Functional redundancy is high among AtMIKC* complexes. (a) Overview of the presence (green), absence (red), and reduced abundance (orange) of the five MIKC* complexes in different mutant backgrounds. Values represent the number (upper row) and percentage (lower row) of AtMIKC*-controlled genes that were downregulated and upregulated in each of the mutants. (b) Graphical representation of the numbers of significantly affected genes shared by different mutants (based on the FIRe macro [38]); virtually all genes affected in agl65 and agl65/66 pollen are also affected in agl66/104 pollen.

